Subscribe:

Monday, 5 December 2011

GBP/JPY

Update 12/12/2011
Reflecting to the new strategy (based on lesson learned from CAD/CHF trade), I have change the profit target to 121.00. This point was reached yesterday, let see if this is reach again and closed today.


Update 07/12/2011
Transaction triggered on 06/12/2011 08:15:31 GMT. Will monitor the chart and adjust the SL and TP accordingly.


GBP/JPY Daily Chart
The overall trend is downtrend with potential resistance at 1.2000 (previous low). But if the chart can't break 1.2500 and start going down, the potential 1.2000 may no longer hold, thus the next resistance would be 117.50
GBP/JPY 4H Chart
Still looking at the downtrend and it 122.50 has topped the chart and the down chart is going toward 119.50
GBP/JPY 1H Chart
The hourly chart magnified the up channel from 4H chart and showing a reversal pattern (divergence).
Contract: Short/Sell
EP: 121.30 (The next low from 1H chart)
SL: 122.50 (The highest point from 1H chart)
PT: 120.00 (From Daily Chart and depending on the chart, could change to 117.50)

As always, risk only 2% or less.

CAD/CHF

Update 12/12/2011
The trade went 'In The Money' for quite sometimes, reach as high as 0.9180-0.9190 but couldn't reach profit target and reversed.
The trade also went on for 3 days....quite sometimes eh. So this kind of gave a reminder about my test trading i.e. target smaller profit target and get out as soon as possible and when you are making a money. Get out and search for another opportunity.

Update 7/12/2011
Transaction triggered on 6/12/2011 07:58:13 GMT. Will monitor the chart and adjust the SL and TP accordingly.


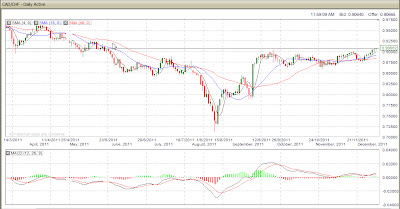
CAD/CHF Daily Chart
Break the resistance of 0.9000 with potential of 0.9250
CAD/CHF 4H Chart
Showing Higher High and Higher Low and above 40 SMA. Indicates an up trend is still in charge

CAD/CHF 1H Chart
The up trend is clearly seen in 1H chart. The next High is 0.9075.

CAD/CHF 15Min
Showing still an up trend and a build up toward 0.9080 (previous high).

CONTRACT: Long/Buy
EP: 0.9090 (a save entry from previous high 0.9070-0.9080)
SL: 0.9000 (seen as previous low/high in Hourly chart)
TP: 0.9250 (resistance level in Daily Chart)

As always, risk only 2% or less.